Many investors seem to be pessimistic about the direction of the market. If history is any indicator though, that’s a bad time to get out of stocks.
The American Association of Individual Investors polls its 125,000-plus members weekly on their expectations for the stock market over the next six months.
The proportion expecting the market to fall is used to form a “bearish” sentiment indicator.
As of 13 February, the trailing eight-week average bearish percentage was about 37.7% – above the historical average of 31.0% since September 1987 and the highest since 16 November 2023.
Investors should be careful how much trust they put into these glass-half-empty views.
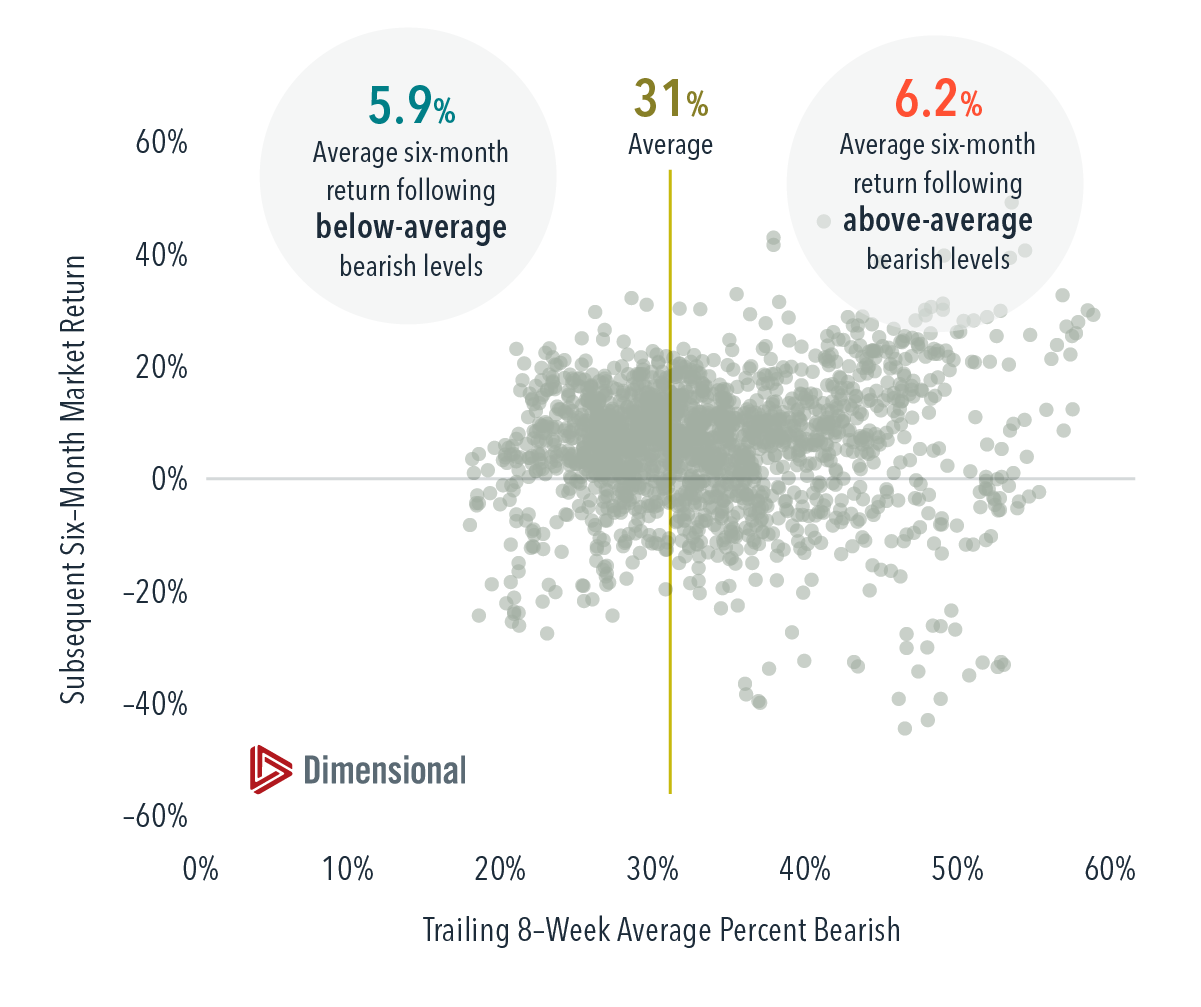
Bearish response levels above the historical mean were followed by an average six-month US market return of 6.2%. That’s close to the average return of 5.9% following below-average bearish levels.
Overall, there’s little discernable relation between the sentiment indicator and subsequent returns.
EXHIBIT 1
Six-Month US Stock Market Returns vs. the Portion of Investors Expecting the Market to Go Down
11 September 1987–31 December 2024
US stock market represented by the Fama/French Total US Market Research Index. Bearish sentiment data provided by the American Association of Individual Investors.
The Fama/French indices represent academic concepts that may be used in portfolio construction and are not available for direct investment or for use as a benchmark. Index returns are not representative of actual portfolios and do not reflect costs and fees associated with an actual investment. See “Index Descriptions” for descriptions of the Fama/French index data.
Index Descriptions
Fama/French Total US Market Research Index: July 1926–present: Fama/French Total US Market Research Factor + One-Month US Treasury Bills. Source: Ken French website.
Results shown during periods prior to each index’s inception date do not represent actual returns of the respective index. Other periods selected may have different results, including losses. Backtested index performance is hypothetical and is provided for informational purposes only to indicate historical performance had the index been calculated over the relevant time periods. Backtested performance results assume the reinvestment of dividends and capital gains. Profitability is measured as operating income before depreciation and amortization minus interest expense scaled by book. Eugene Fama and Ken French are members of the Board of Directors of the general partner of, and provide consulting services to, Dimensional Fund Advisors LP.
Disclosures
The information in this material is intended for the recipient’s background information and use only. It is provided in good faith and without any warranty or representation as to accuracy or completeness. Information and opinions presented in this material have been obtained or derived from sources believed by Dimensional to be reliable, and Dimensional has reasonable grounds to believe that all factual information herein is true as at the date of this material. It does not constitute investment advice, a recommendation, or an offer of any services or products for sale and is not intended to provide a sufficient basis on which to make an investment decision. Before acting on any information in this document, you should consider whether it is appropriate for your particular circumstances and, if appropriate, seek professional advice. It is the responsibility of any persons wishing to make a purchase to inform themselves of and observe all applicable laws and regulations. Unauthorized reproduction or transmission of this material is strictly prohibited. Dimensional accepts no responsibility for loss arising from the use of the information contained herein.
This material is not directed at any person in any jurisdiction where the availability of this material is prohibited or would subject Dimensional or its products or services to any registration, licensing, or other such legal requirements within the jurisdiction.
“Dimensional” refers to the Dimensional separate but affiliated entities generally, rather than to one particular entity. These entities are Dimensional Fund Advisors LP, Dimensional Fund Advisors Ltd., Dimensional Ireland Limited, DFA Australia Limited, Dimensional Fund Advisors Canada ULC, Dimensional Fund Advisors Pte. Ltd., Dimensional Japan Ltd., and Dimensional Hong Kong Limited. Dimensional Hong Kong Limited is licensed by the Securities and Futures Commission to conduct Type 1 (dealing in securities) regulated activities only and does not provide asset management services.
Risks
Investments involve risks. The investment return and principal value of an investment may fluctuate so that an investor’s shares, when redeemed, may be worth more or less than their original value. Past performance is not a guarantee of future results. There is no guarantee strategies will be successful.
This material is issued by DFA Australia Limited (AFS License No. 238093, ABN 46 065 937 671). This material is provided for information only. No account has been taken of the objectives, financial situation or needs of any particular person. Accordingly, to the extent this material constitutes general financial product advice, investors should, before acting on the advice, consider the appropriateness of the advice, having regard to the investor’s objectives, financial situation and needs. Investors should also consider the Product Disclosure Statement (PDS) and the target market determination (TMD) that have been made for each financial product either issued or distributed by DFA Australia Limited prior to acquiring or continuing to hold any investment. Go to dimensional.com/funds to access a copy of the PDS or the relevant TMD. Any opinions expressed in this material reflect our judgement at the date of publication and are subject to change.


