
Prime Ministers are just one factor potentially affecting markets.
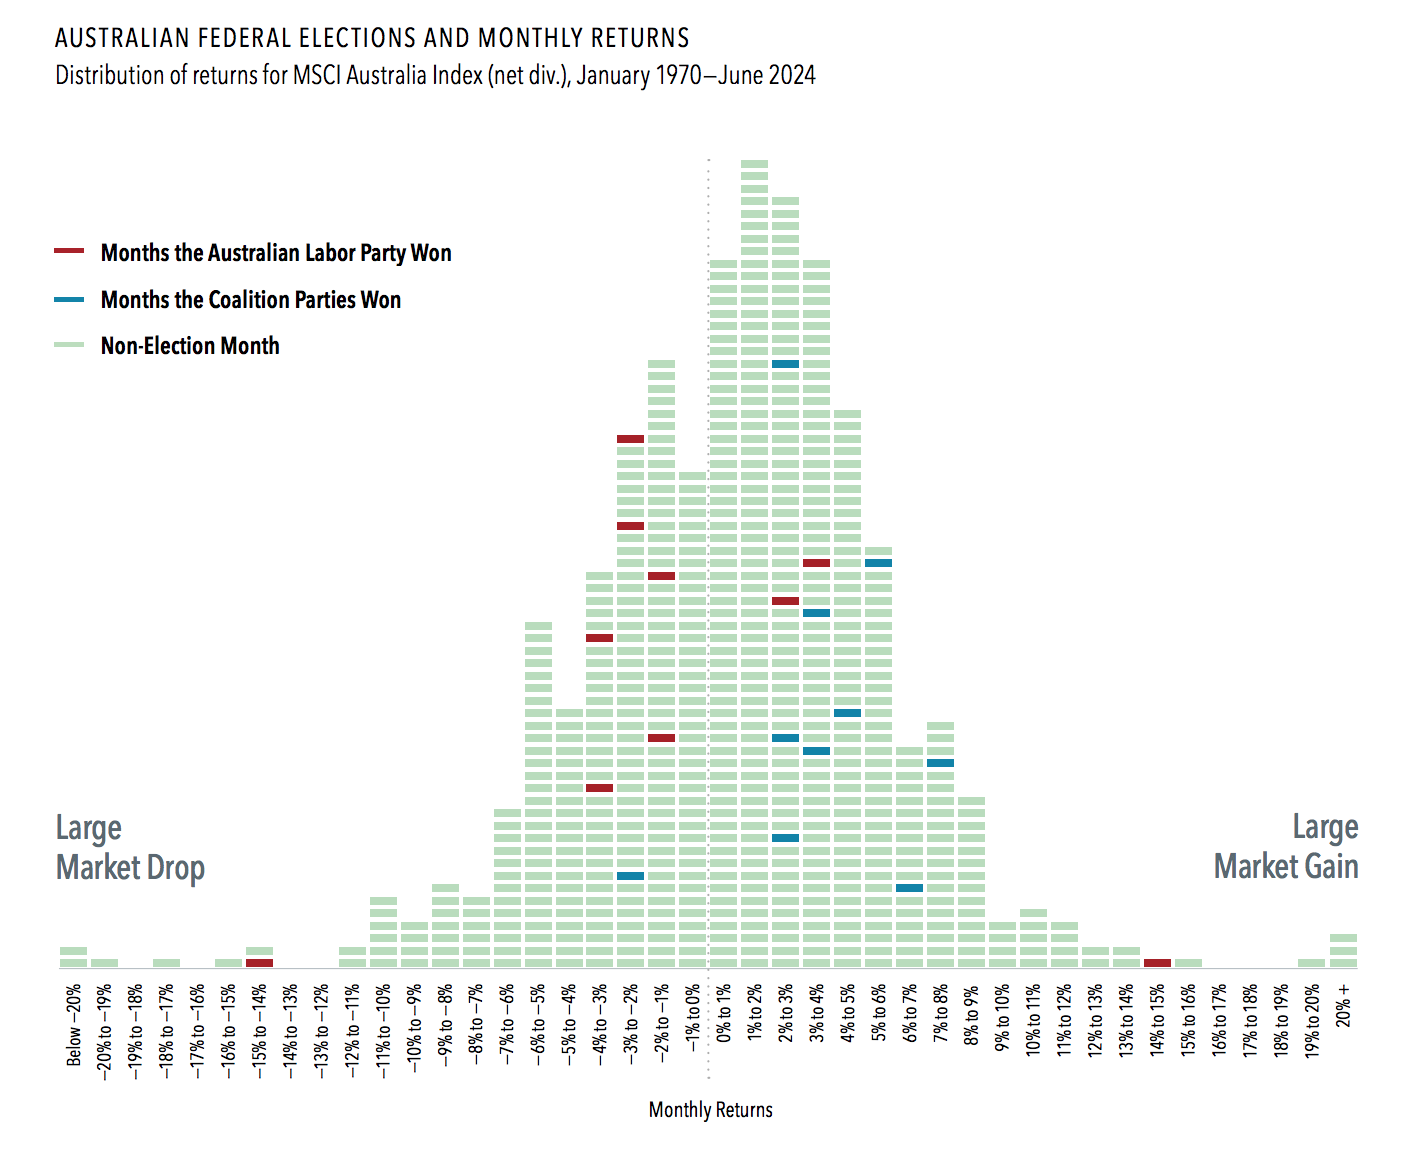
The history of the stock market going back to 1970 shows that returns in months when federal elections took place don’t reflect any consistent patterns.
This chart shows the MSCI Australia Index (net div.), with each horizontal dash representing a month, arranged from left to right by market return in 1% increments.
Past performance is not a guarantee of future results.
Most election months haven’t produced extreme returns in one direction or the other.
The winning party hasn’t been a reliable driver for the direction or magnitude of market movements in election months either.
The history of market behaviour during election months makes a strong case for sticking with a plan to achieve long-term goals.
Disclosures
Image: First Among Equals 2nd Edition, Exisle Publishing
Past performance is not a guarantee of future results. Indices are not available for direct investment. In AUD. Dashes representing returns for a given month are stacked in ascending order of return within each column, with highest return within that range on top. Election data source: https://www.aec.gov.au/elections/federal_elections/ MSCI data © MSCI 2024, all rights reserved.
This material is issued by DFA Australia Limited (AFS License No. 238093, ABN 46 065 937 671). This material is provided for information only. No account has been taken of the objectives, financial situation or needs of any particular person. Accordingly, to the extent this material constitutes general financial product advice, investors should, before acting on the advice, consider the appropriateness of the advice, having regard to the investor’s objectives, financial situation and needs. Investors should also consider the Product Disclosure Statement (PDS) and the target market determination (TMD) that have been made for each financial product either issued or distributed by DFA Australia Limited prior to acquiring or continuing to hold any investment. Go to dimensional.com/funds to access a copy of the PDS or the relevant TMD. Any opinions expressed in this material reflect our judgement at the date of publication and are subject to change.


