
Every year, many investment and consulting firms release new CMAs, or capital market assumptions.
CMAs can be useful for setting risk and return expectations and for long-term financial planning. However, as the old saying goes, it’s difficult to make predictions, especially about the future.1
Even well-constructed CMAs are not a crystal ball and, when used inappropriately, can lead to suboptimal outcomes for investors.2
While it will take some time until the accuracy of this season’s CMAs can be determined, we can compare previous asset class return forecasts to realised outcomes.
In this analysis, we look at forecasts by 10 asset management and investment advisor firms for the 10-year period 2014 to 2023. Our analysis includes the major asset classes covered most often by forecasters.
However, firms differ in the asset classes for which they issue forecasts, so the number of forecasts included for each asset class in our analysis varies.
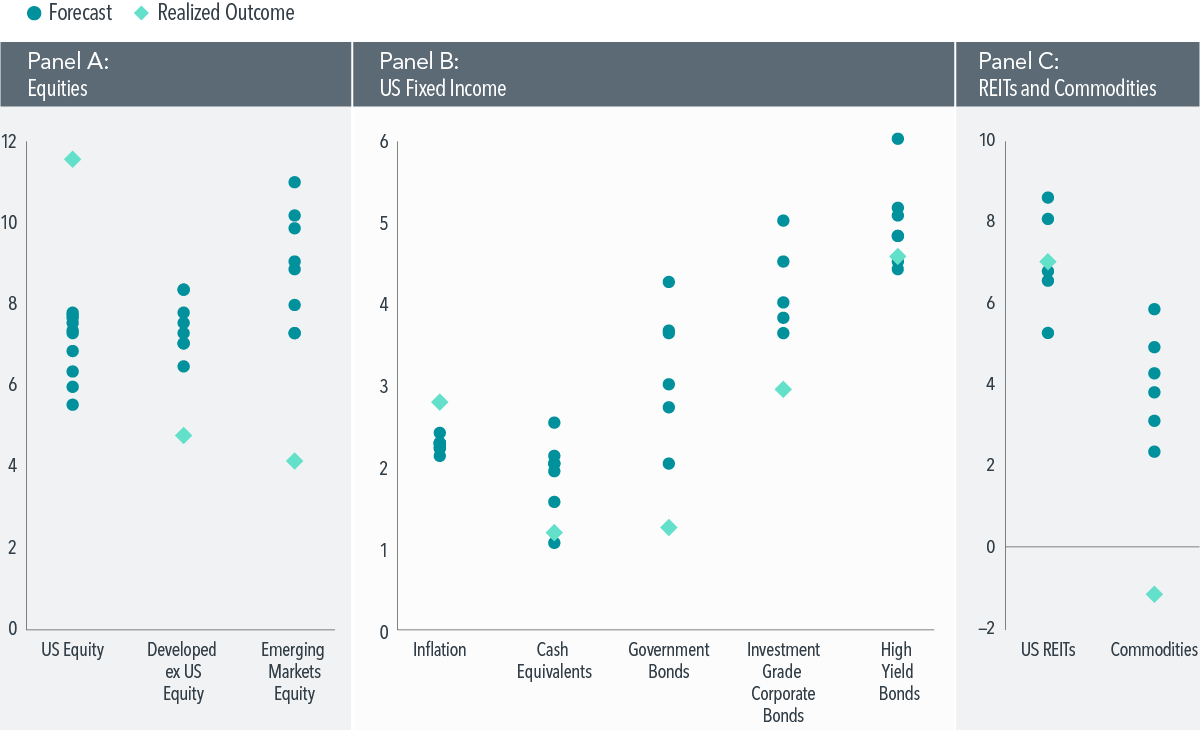
Exhibit 1, Panel A presents annualised compound nominal return forecasts for US, developed ex US, and emerging markets equities (blue dots) against realised returns (light blue diamonds).
We see wide dispersion across forecasts in all regions. For example, forecasts for US equities range from about 5.5% to 7.7% annualised, which translates to 10-year cumulative returns of about 70% to 110%. The realised return, however, lies well above the range at 11.5% annualised, or a nearly 198% cumulative return.3
For emerging markets equities, the forecast dispersion was even greater, although all forecasts turned out to be overly optimistic.
Across all regions, equity forecasts differed from reality by 1.7 to 6.8 percentage points, with an average error of a little over 4 percentage points.
In Panel B, we show the results for sub asset classes within US fixed income as well as inflation. Fixed income asset classes tend to have lower volatility compared to equities, and yet we still see meaningful dispersion across forecasts, on the order of 2 percentage points annualised.
In terms of forecasting accuracy, all firms underestimated inflation, and most firms overestimated bond returns, with the realised return falling outside the entire forecast range for both government and investment-grade corporate bonds.
Overall, forecasting errors range from 0.1 percentage points to 3 percentage points.
Panel C reports results for US REITs and commodities.
REIT forecasts were off by approximately 1 percentage point on average, with an error range of 0.3 to 1.8 percentage points.
Commodity forecasts exhibited the greatest degree of error in our study, with even the best forecast off by more than 3 percentage points and an average difference versus reality across forecasts of a little over 5 percentage points.
Exhibit 1
Margins of Error
Forecast vs. realised nominal returns of major asset classes (%), 2014–2023
While some forecasts turned out to be closer to the actual outcomes than others, no firm’s forecasts stood above the rest as consistently more accurate. These results are consistent with those of other studies based on different time periods or CMA providers.4
Given the level of variability we see in the accuracy of CMAs, it is worth asking how much weight should be put on them when building portfolios.
Rather than relying on a crystal ball that does not exist, planning for the possible range of outcomes can better prepare investors for what’s ahead.
When setting expectations about potential outcomes, we believe a sensible starting point is to look at the long-term historical performance of asset classes, to incorporate information from real-time market prices when relevant, and to consider a wide range of possible values.
Glossary
Capital market assumptions: Expectations of performance, including return, volatility, or correlation, across various asset classes.
Commodities: Goods that are interchangeable between producers, such as oil, wheat, or gold.
Cumulative return: Aggregate return over a set period of time.
Dispersion: A measure of the variation in values.
High-yield bonds: Bonds with a credit rating below investment grade that are typically considered to be at greater risk of default but offer higher yields.
Investment-grade corporate bonds: Bonds that are rated Baa (by Moody’s) or BBB (by S&P and Fitch) or above and are typically considered to have a lower risk of default.
Nominal return: The rate of return on an investment without adjusting for inflation.
Footnotes
1. While the actual origin is unknown, this quote has been attributed to multiple people, including baseball player Yogi Berra and physicist Niels Bohr.
2. See, for example, Jim Davis, “Efficient Frontiers Constructed with Historical Data Can Be Misleading” (research paper, Dimensional Fund Advisors, October 2008).
3. Returns in USD. US stock market represented by the Fama/French Total US Market Research Index.
4. See, for example, Mike Sebastian, “The Accuracy and Use of Capital Market Assumptions” (research paper, SSRN, October 24, 2023).
Appendix
Additional Methodology Information
For our analysis, we examined published materials of 62 firms for capital market assumptions. The 10 firms included in our analysis are those for which we found 10-year asset class return forecasts for the period 2014–2023. The majority of the CMAs included in this analysis are taken from forecasts dated as of December 2013, but one set was as of September 2013, and one set was as of February 2014.
Index Descriptions
Fama/French Total US Market Research Index: July 1926–present: Fama/French Total US Market Research Factor + One-Month US Treasury Bills. Source: Ken French website.
Fama/French International Market Index: January 1975–present: Source: Ken French website. Simulated from MSCI and Bloomberg data.
Fama/French Emerging Markets Index: July 1989–present: Fama/French Emerging Markets Index. Courtesy of Fama/French from Bloomberg and IFC securities data. Companies weighted by float-adjusted market cap; rebalanced annually in June.
Results shown during periods prior to each index’s inception date do not represent actual returns of the respective index. Other periods selected may have different results, including losses. Backtested index performance is hypothetical and is provided for informational purposes only to indicate historical performance had the index been calculated over the relevant time periods. Backtested performance results assume the reinvestment of dividends and capital gains. Profitability is measured as operating income before depreciation and amortization minus interest expense scaled by book.
Eugene Fama and Ken French are members of the Board of Directors of the general partner of, and provide consulting services to, Dimensional Fund Advisors LP.
Disclosures
The information in this material is intended for the recipient’s background information and use only. It is provided in good faith and without any warranty or representation as to accuracy or completeness. Information and opinions presented in this material have been obtained or derived from sources believed by Dimensional to be reliable, and Dimensional has reasonable grounds to believe that all factual information herein is true as at the date of this material. It does not constitute investment advice, a recommendation, or an offer of any services or products for sale and is not intended to provide a sufficient basis on which to make an investment decision. Before acting on any information in this document, you should consider whether it is appropriate for your particular circumstances and, if appropriate, seek professional advice. It is the responsibility of any persons wishing to make a purchase to inform themselves of and observe all applicable laws and regulations. Unauthorized reproduction or transmission of this material is strictly prohibited. Dimensional accepts no responsibility for loss arising from the use of the information contained herein.
This material is not directed at any person in any jurisdiction where the availability of this material is prohibited or would subject Dimensional or its products or services to any registration, licensing, or other such legal requirements within the jurisdiction.
“Dimensional” refers to the Dimensional separate but affiliated entities generally, rather than to one particular entity. These entities are Dimensional Fund Advisors LP, Dimensional Fund Advisors Ltd., Dimensional Ireland Limited, DFA Australia Limited, Dimensional Fund Advisors Canada ULC, Dimensional Fund Advisors Pte. Ltd., Dimensional Japan Ltd., and Dimensional Hong Kong Limited. Dimensional Hong Kong Limited is licensed by the Securities and Futures Commission to conduct Type 1 (dealing in securities) regulated activities only and does not provide asset management services.
Risks
Investments involve risks. The investment return and principal value of an investment may fluctuate so that an investor’s shares, when redeemed, may be worth more or less than their original value. Past performance is not a guarantee of future results. There is no guarantee strategies will be successful.
This material is issued by DFA Australia Limited (AFS License No. 238093, ABN 46 065 937 671). This material is provided for information only. No account has been taken of the objectives, financial situation or needs of any particular person. Accordingly, to the extent this material constitutes general financial product advice, investors should, before acting on the advice, consider the appropriateness of the advice, having regard to the investor’s objectives, financial situation and needs. Investors should also consider the Product Disclosure Statement (PDS) and the target market determination (TMD) that have been made for each financial product either issued or distributed by DFA Australia Limited prior to acquiring or continuing to hold any investment. Go to dimensional.com/funds to access a copy of the PDS or the relevant TMD. Any opinions expressed in this material reflect our judgement at the date of publication and are subject to change.


