
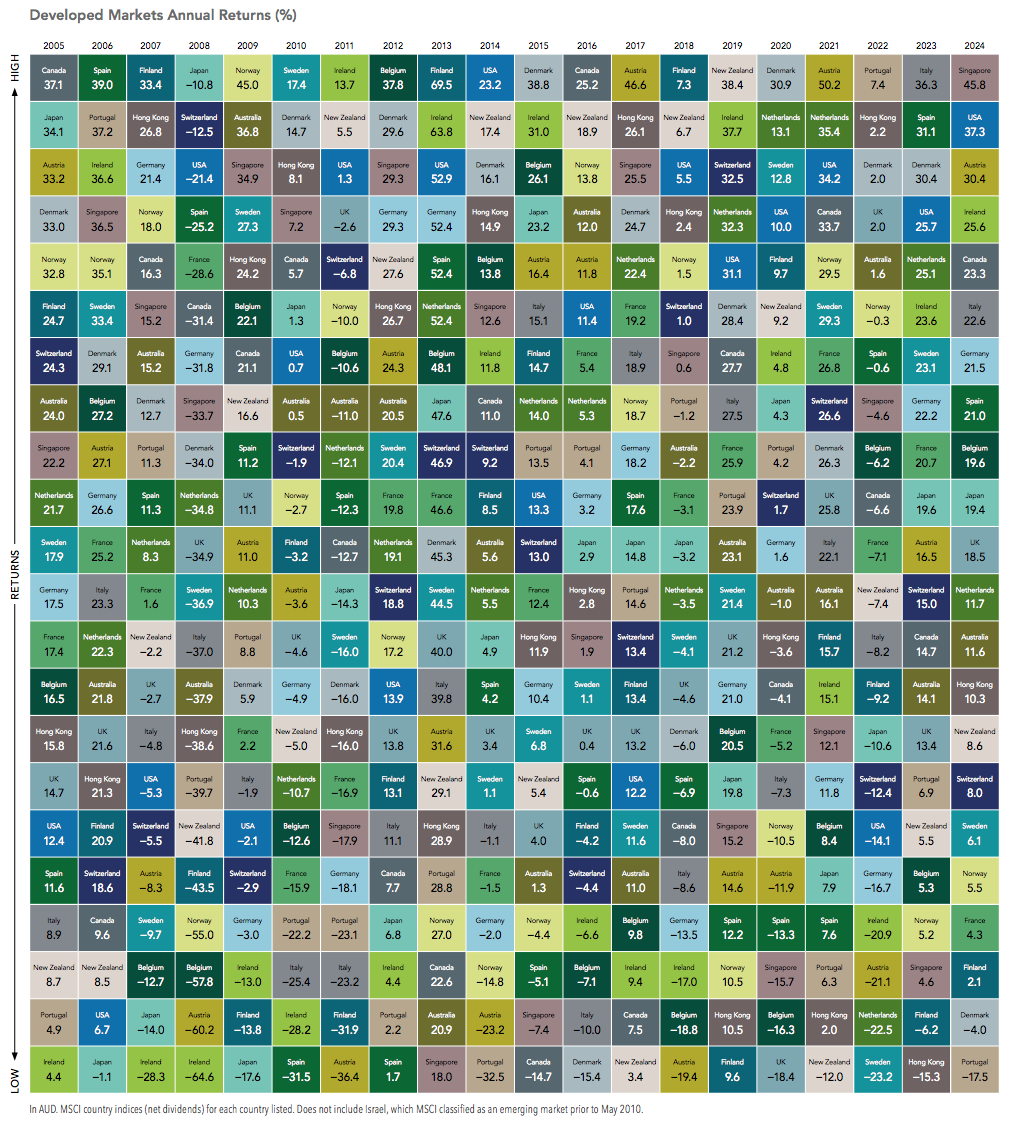
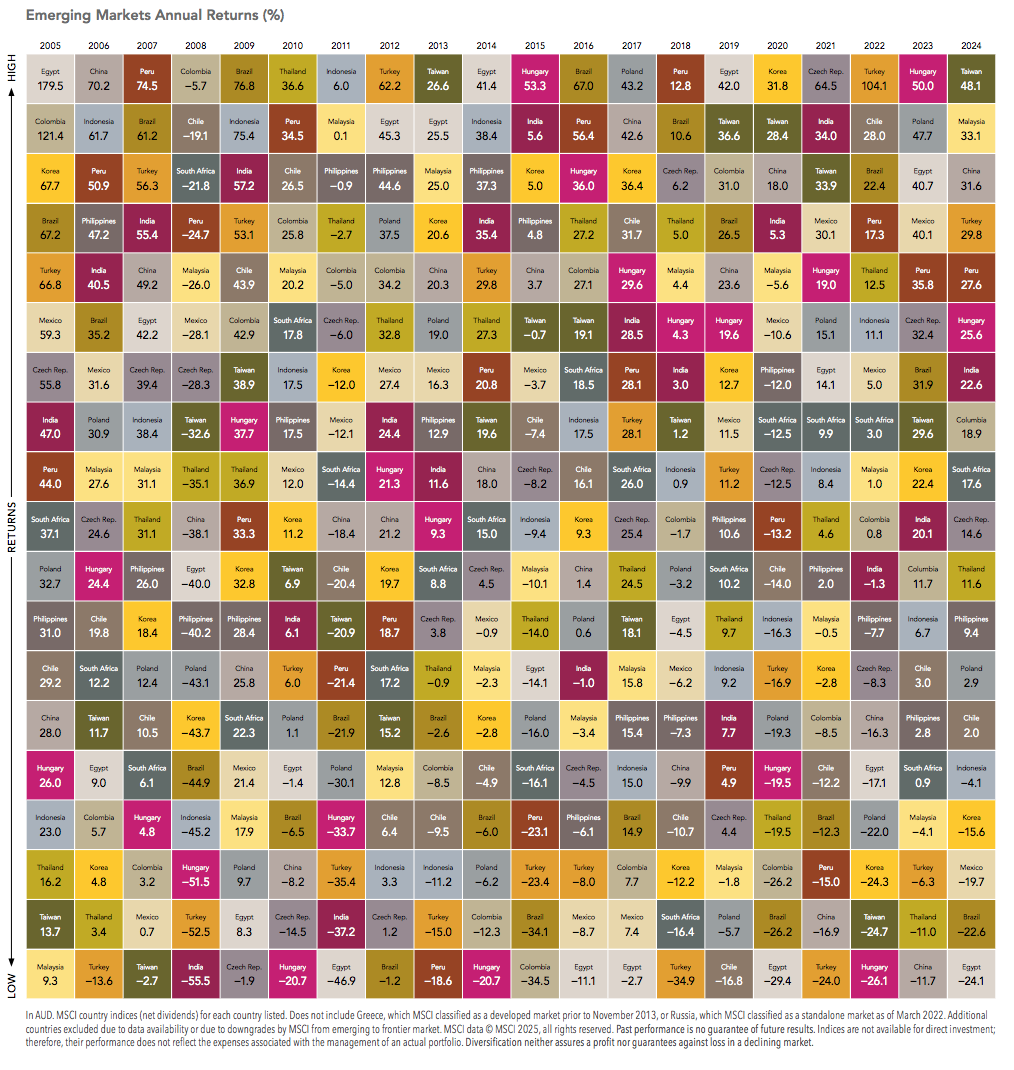
The two tables below rank historical annual stock market performance for different developed and emerging markets from highest to lowest in each year.
Each colour corresponds to a different country, and the patchwork dispersion of colours shows no predictable pattern in either the developed or the emerging markets.
Investors who follow a structured, diversified strategy are therefore more likely to capture the returns wherever they happen to occur in any given year.
This diversified strategy also reduces the risk of being too heavily invested in any one country that happens to perform particularly badly in any given year.
Disclosures
All rights reserved. Unauthorised copying, reproducing, duplicating or transmitting of this material is prohibited. © 2025 Dimensional Fund Advisors LP. This material is issued by DFA Australia Limited (AFS License No. 238093, ABN 46 065 937 671). This material is provided for information only. No account has been taken of the objectives, financial situation or needs of any particular person. Accordingly, to the extent this material constitutes general financial product advice, investors should, before acting on the advice, consider the appropriateness of the advice, having regard to the investor’s objectives, financial situation and needs. Investors should also consider the Product Disclosure Statement (PDS) and the target market determination (TMD) that have been made for each financial product either issued or distributed by DFA Australia Limited prior to acquiring or continuing to hold any investment. Go to dimensional.com/funds to access a copy of the PDS or the relevant TMD. Any opinions expressed in this material reflect our judgement at the date of publication and are subject to change.


